
Dashboard
The Dashboard in User Management & License Optimizer serves as your central overview for understanding user activity and license utilization across all your Atlassian products and sites. After initial setup, it's the first destination for administrators to gain immediate insights into their organization's user landscape.
Dashboard Data
Dashboard data refreshes after each sync. Run a manual sync from Settings > User Data Sync to see the latest numbers.
Prerequisite
The Dashboard requires a valid Organization API Key. Configure your API key in Settings before the Dashboard displays data. Without an API key, the app cannot sync user data from your Atlassian organization.
Key Features
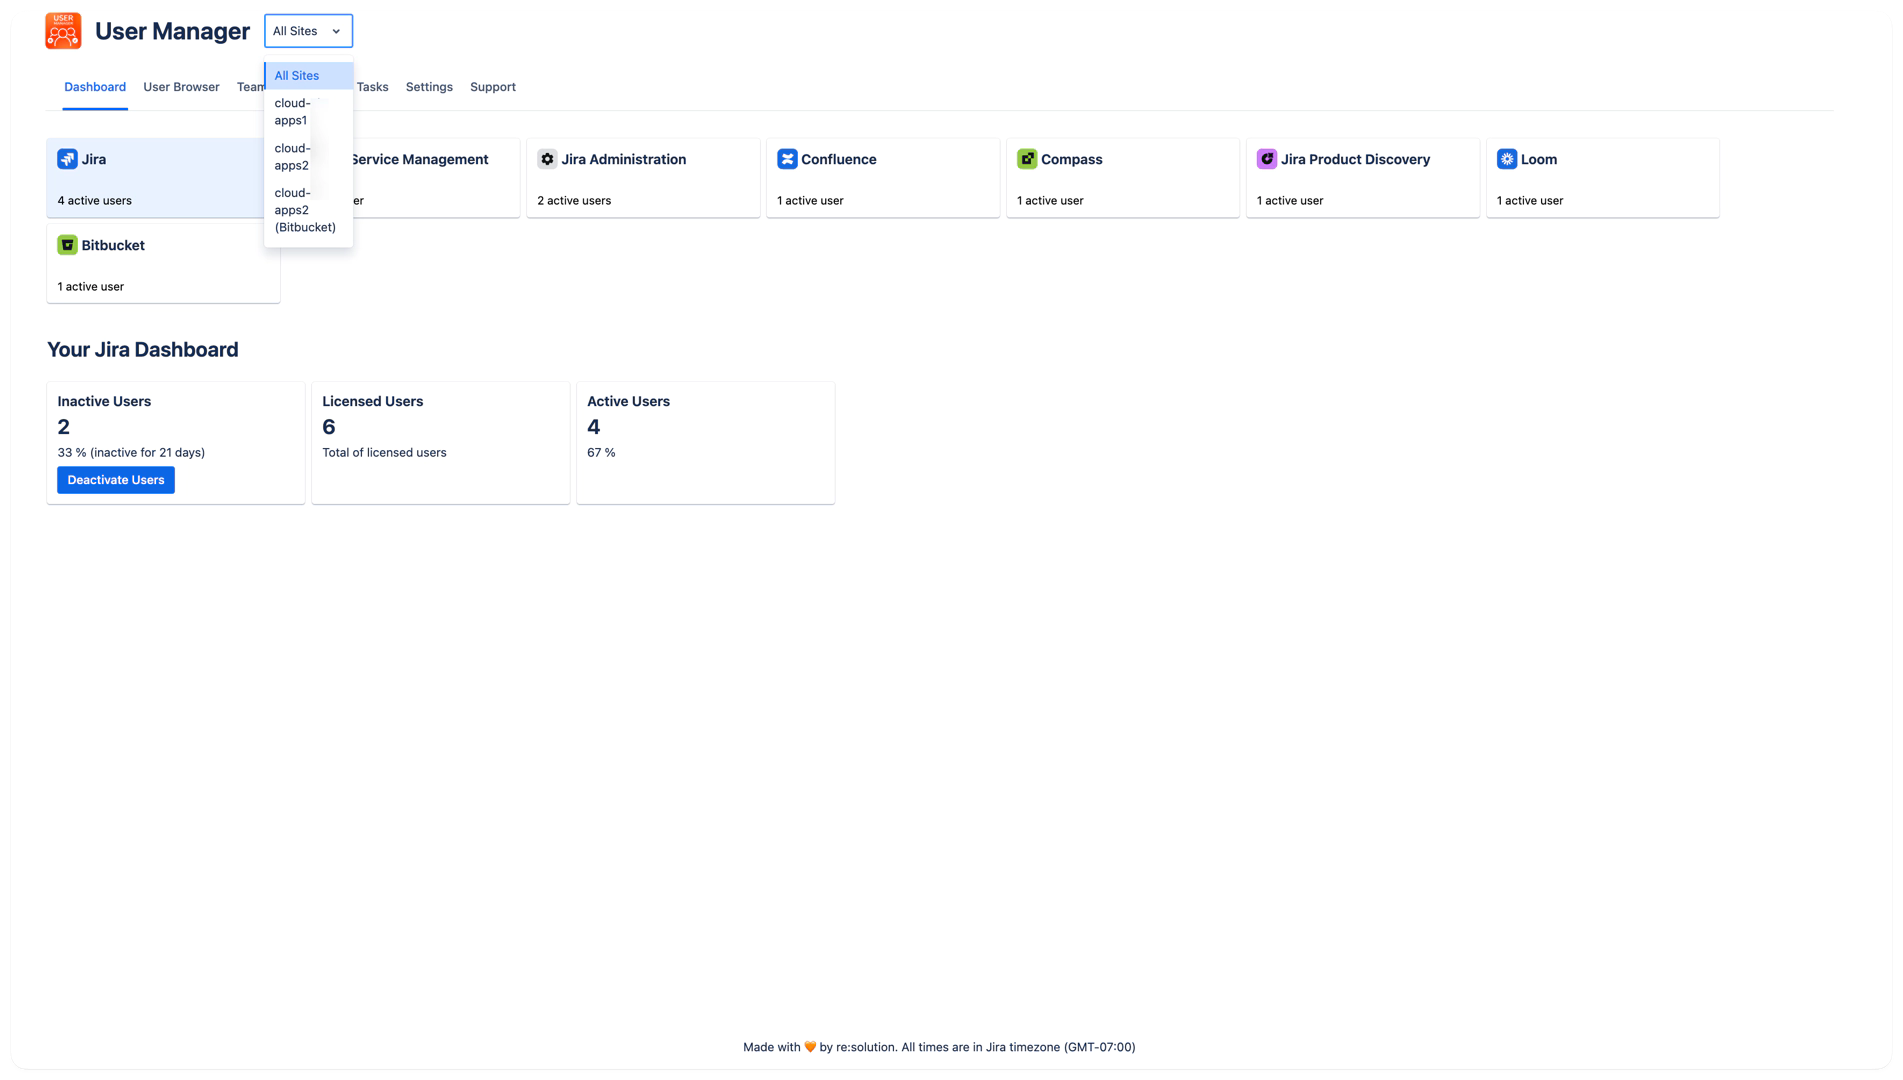
Multi-Site Overview
The dashboard provides a consolidated view of all connected Atlassian sites through the site selector in the top navigation. You can:
View metrics for All Sites to see organization-wide statistics
Select individual sites to drill down into site-specific usage
Access harmonized Bitbucket workspaces, which appear as separate sites in the selector
Product Tiles
The dashboard displays tiles for each Atlassian product in your organization, including Jira, Jira Service Management, Jira Administration, Confluence, Assets, Goals, Projects, Rovo, Customer Service Management, Bitbucket, and Atlas. Each tile shows:
Active Users: Currently active users for that product
Inactive Users: Users who haven't accessed the product within your defined inactivity period
Total Users: All licensed users (excluding customers and guests)
Percentage Metrics: Visual representation of active vs. inactive users
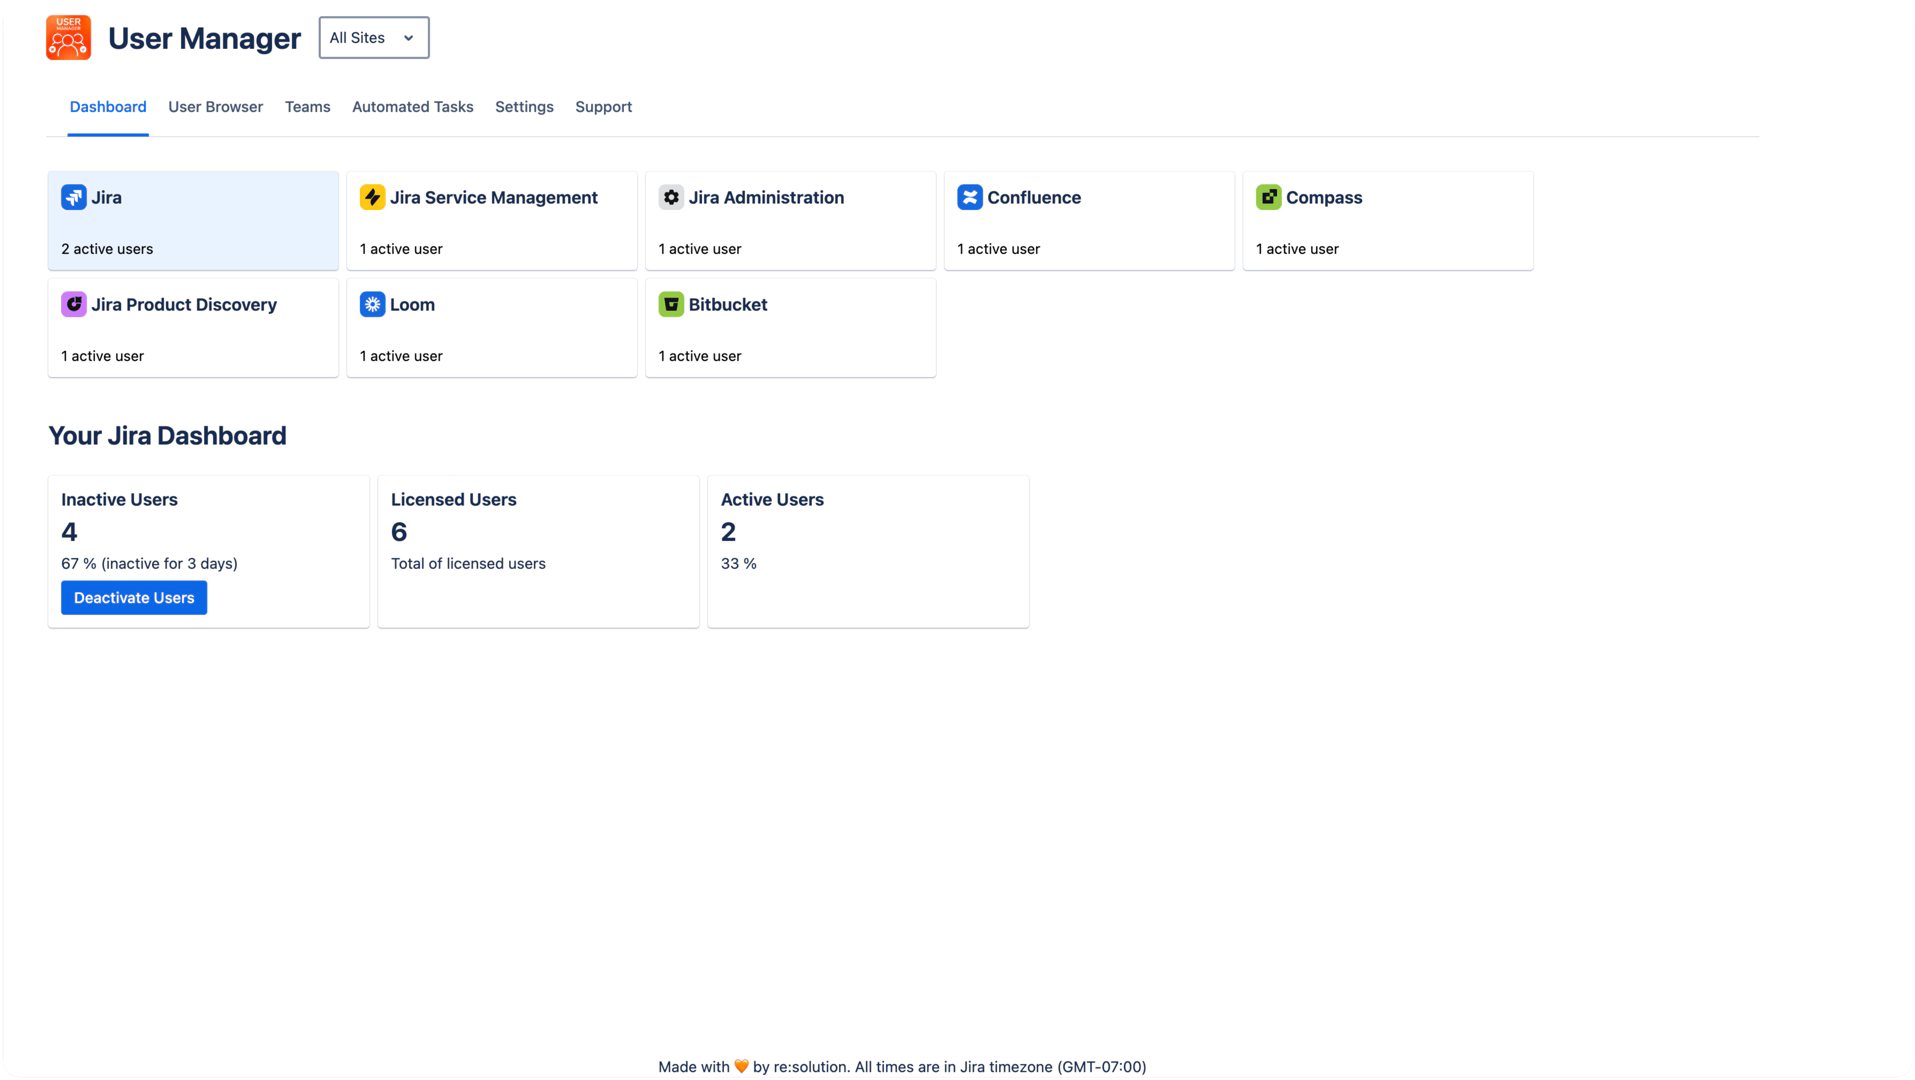
Understanding the Metrics
Total Users
This represents all licensed users for each product - essentially your billable user count. The dashboard focuses on users with active status who consume licenses, excluding:
Jira Service Management customers
Confluence guests
Jira Product Discovery contributors (idea creation only)
Deactivated or suspended users
Free product-only users
Active vs. Inactive Users
The relationship is straightforward:
If you have 100 total licensed users
And 10 are marked as inactive based on your Settings tab
Then 90 users will show as active
Site Aggregation
When viewing "All Sites":
User counts are summed across all sites for each product
Provides an organization-wide view of license utilization
Helps identify optimization opportunities across your entire organization
Navigation and Interaction
Site Selection
The site selector dropdown allows you to:
View aggregated data across all sites
Filter to see metrics for a specific site
Include Bitbucket workspaces (marked as Bitbucket sites)
Product Deep Dives
Click on any product tile to:
See detailed inactive user lists
Access the User Browser filtered for that product
Initiate bulk operations for license optimization
Special Considerations
Bitbucket Integration
While Bitbucket doesn't follow Atlassian's standard site concept, User Management & License Optimizer harmonizes this by:
Creating virtual sites for each Bitbucket workspace
Clearly marking these as Bitbucket sites in the selector
Providing the same metrics and management capabilities
Trello Exclusion
Note that Trello is not currently supported by User Management & License Optimizer.
Best Practices
Regular Reviews: Check the dashboard weekly to identify inactive users and optimization opportunities
Site Comparison: Use the site selector to compare usage patterns across different teams or regions
Quick Actions: Click Show Inactive Users or Show Licensed Users on the dashboard summary to navigate to the User Browser with pre-applied filters
Trend Monitoring: Watch for patterns in user activity to predict future license needs
Related Pages
Searching and Filtering - Drill down into user details
Performing Bulk Operations - Take action on filtered users
Billing Models - Understand license tiers
First-Time Setup - Initial dashboard configuration