
Exporting the User List
The User Browser can export your user list to an Excel file (.xlsx). The export captures every user currently shown in the User Browser, together with their status, group memberships, product access, roles and sites. Use it for license reviews, audits, reporting, or to analyse the data in Excel, Google Sheets or a BI tool.
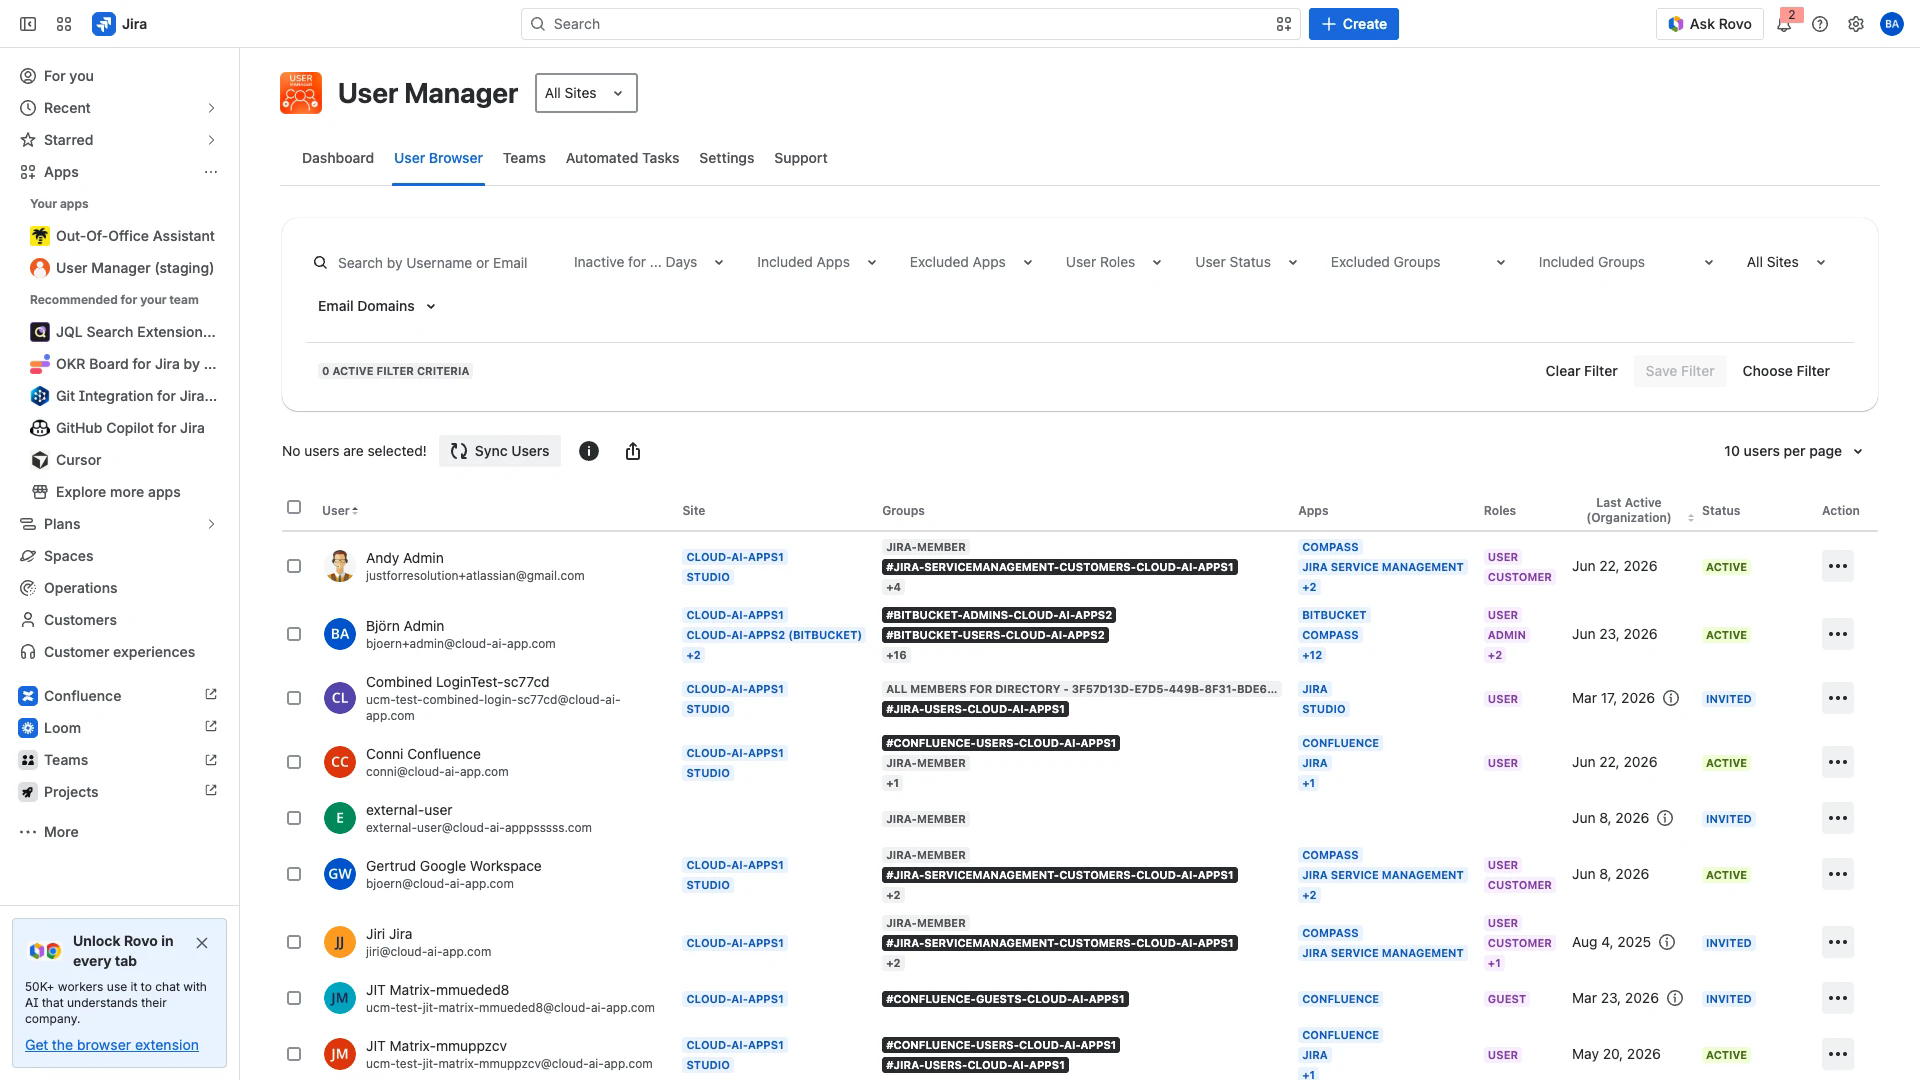
The Export to Excel button in the User Browser action bar.
What the export contains
Every export is a single Excel workbook with two sheets: a Summary sheet and a Users sheet.
Summary sheet
The Summary sheet records who created the export, when, and which filters were applied. It lets anyone reviewing the file understand its scope without opening the data.
Field | Description |
|---|---|
Export date | Date and time the export was generated, in the Jira timezone. |
Exported by | Display name of the administrator who ran the export. |
Site URL | The site the export was started from. |
Users exported | Number of distinct users in the file. |
Unique groups | Number of distinct groups referenced across all users. |
Total rows in Users sheet | Total data rows on the Users sheet (see the grain note below). |
Filter criteria | Lists each filter that was active when the export ran (for example Included apps: Confluence). Empty when no filter was applied. |
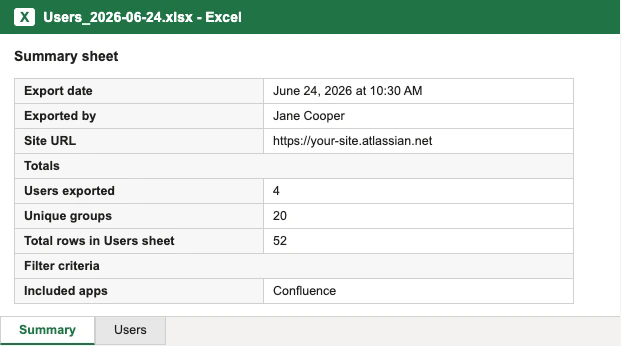
The Summary sheet records the scope and any filters applied.
Users sheet
The Users sheet holds the full data. It has twelve columns:
Column | Description |
|---|---|
Account ID | The user's Atlassian account ID. Stable across products and sites. |
Display Name | The user's name as shown in Atlassian. |
The user's email address. | |
Status | The Atlassian organization account status (for example active, invited, suspended, deactivated). |
Last Active (Organization) | The user's most recent activity anywhere in the organization. |
Last Active (Product) | The user's most recent activity in the specific product and site on that row. Blank on group-membership rows. |
Record Type | Either Product access or Group membership (see below). |
Group | The group name for the row. |
Group ID | The group's unique identifier. |
App | The product the row grants access to (for example Jira, Confluence). Blank on group-membership rows. |
Role | The product role for that access (for example atlassian/user, atlassian/admin). Blank on group-membership rows. |
Site | The site the access applies to. Bitbucket access is reported against its Bitbucket workspace. |
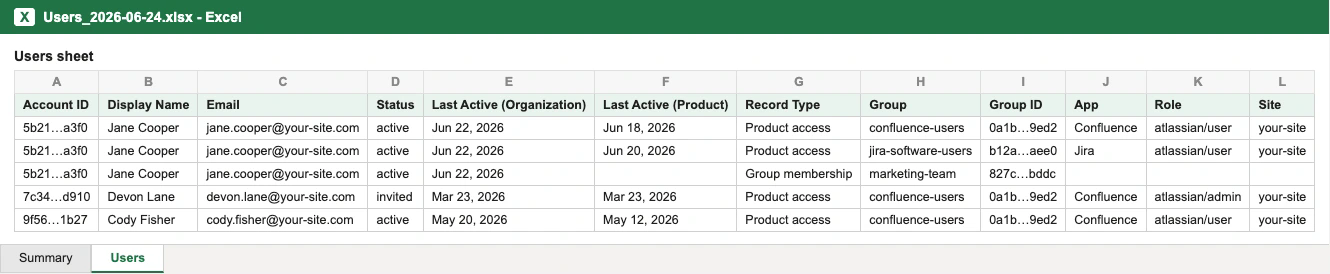
The Users sheet holds one row per user, group, app, role and site combination.
One user can span several rows. The Users sheet is denormalized: there is one row for each combination of user, group, app, role and site. A user who belongs to many groups and has access to several products will appear on many rows. To count users or build per-user metrics, use a distinct count on the Account ID column rather than counting rows.
Record types
The Record Type column tells you what each row represents:
Product access: the user has access to the product in the App column, with the role and site shown. App, Role and Site are filled in.
Group membership: the user belongs to the group in the Group column, but that group does not grant product access. App, Role and Site are blank.
This lets you separate license-consuming product access from plain group membership in the same file.
Exporting all users
To export the complete user list:
Open the User Browser.
Leave the filters empty and do not select any individual users.
Click Export to Excel in the action bar.
The file downloads as
Users_<date>.xlsx.
The export reflects the data from the last sync. To capture recent changes made in admin.atlassian.com or through your identity provider, run Sync Users before exporting.
Exporting a filtered list
You can narrow the export to exactly the users you care about by filtering the User Browser first. The export always matches what the User Browser shows.
Apply one or more filters, such as Included Apps, User Status, Included Groups or Site.
Confirm the user list shows the users you expect.
Click Export to Excel.
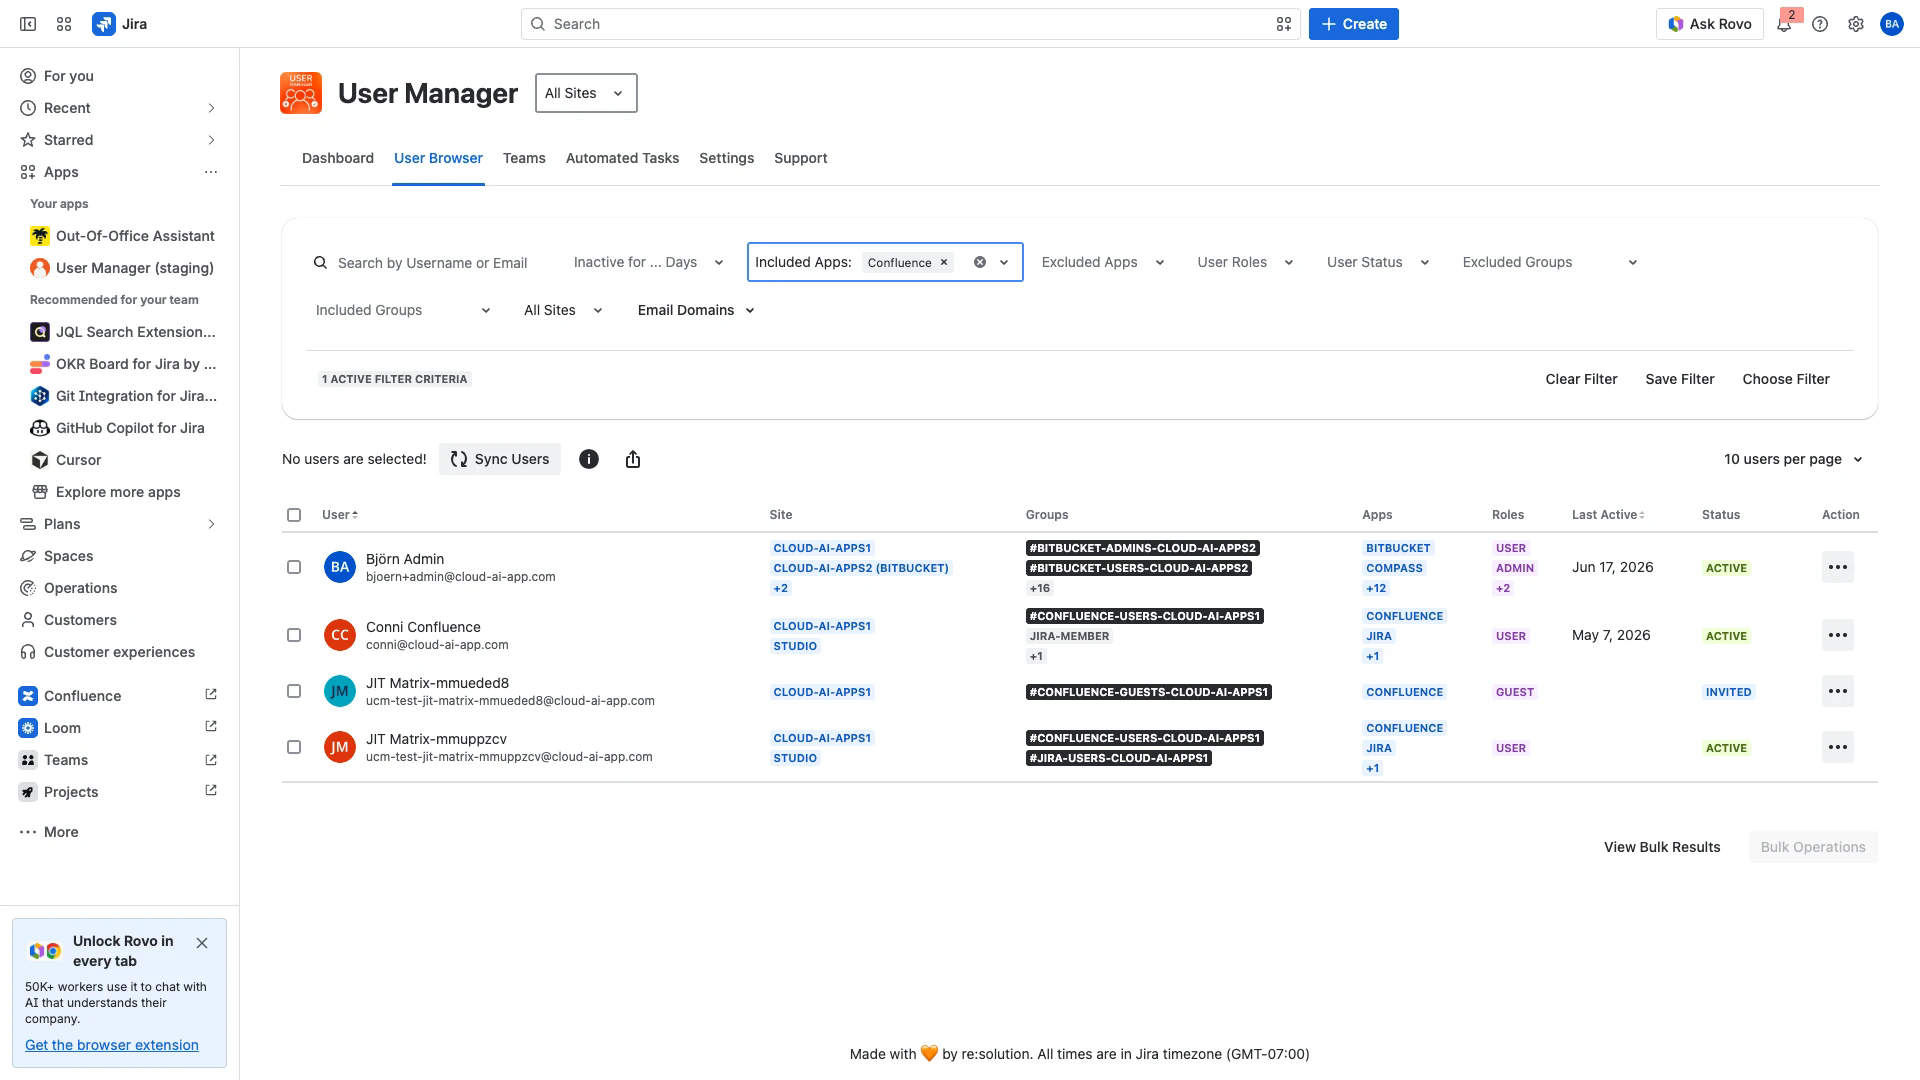
Filtering by Included Apps before exporting. Only the matching users are exported.
The export then contains only the users that match the filter, and the Summary sheet lists the applied filter under Filter criteria.
Filters select which users to export. Each matching user is exported with their full record, so a user matched by a Confluence filter still shows all of their other products and groups on their rows. This mirrors how the User Browser itself works.
Tips for analysis
Use a distinct count on Account ID for accurate user counts.
Filter the Record Type column to Product access to focus on license-consuming access.
Build a pivot table on the App column to see how product access is distributed across your organization.
Compare Last Active (Product) against a cut-off date to find candidates for license cleanup.
Using the export in a BI tool
Because the Users sheet is flat and fully expanded, it loads directly into any BI or spreadsheet tool (for example Excel, Google Sheets, Power BI, Tableau or Zoho Analytics) without extra preparation. Point the tool at the Users sheet and build charts on the columns. Remember to aggregate with a distinct count of Account ID so that users are not counted once per row.
A bar chart grouped by Site with a distinct count of Account ID shows how many users have access on each site.
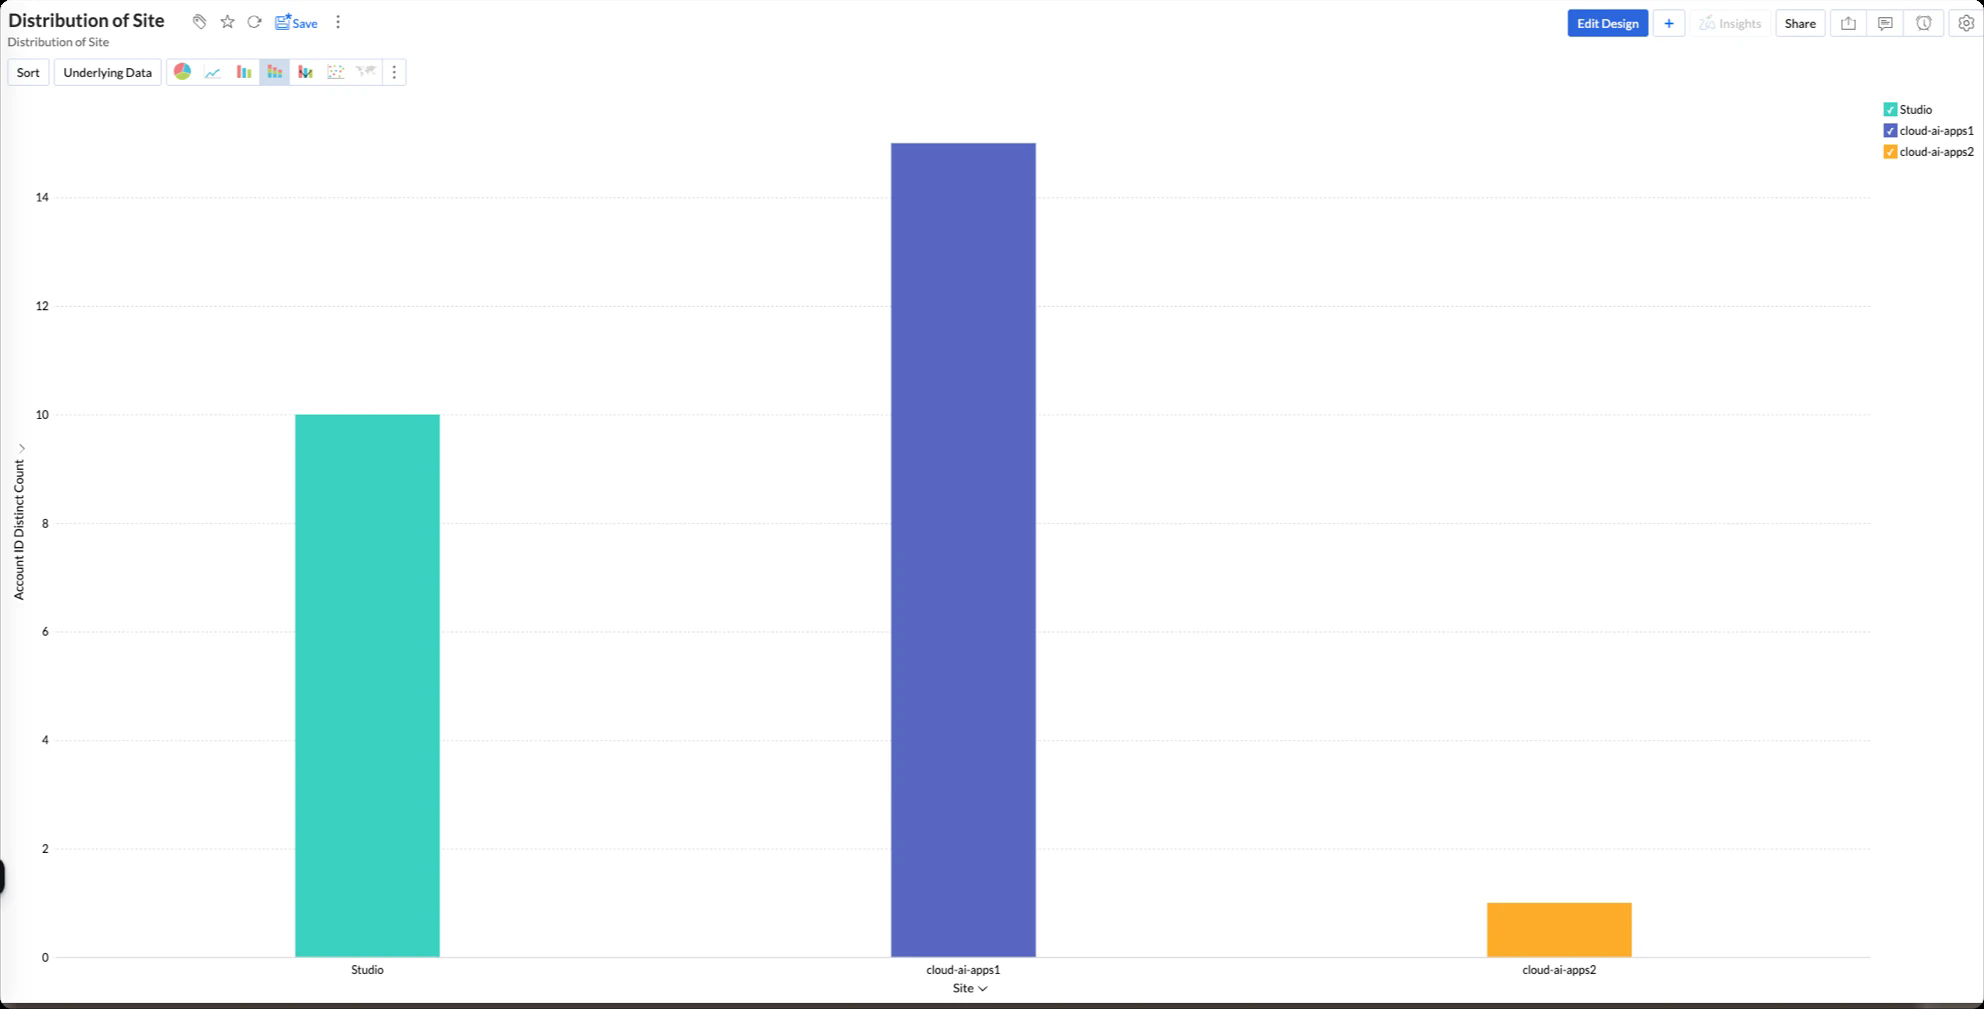
Distinct users per site, built from the Site and Account ID columns.
A flow (Sankey) chart across Display Name, App and Site visualises how each user's access spreads over products and sites, which helps spot over-provisioned accounts.
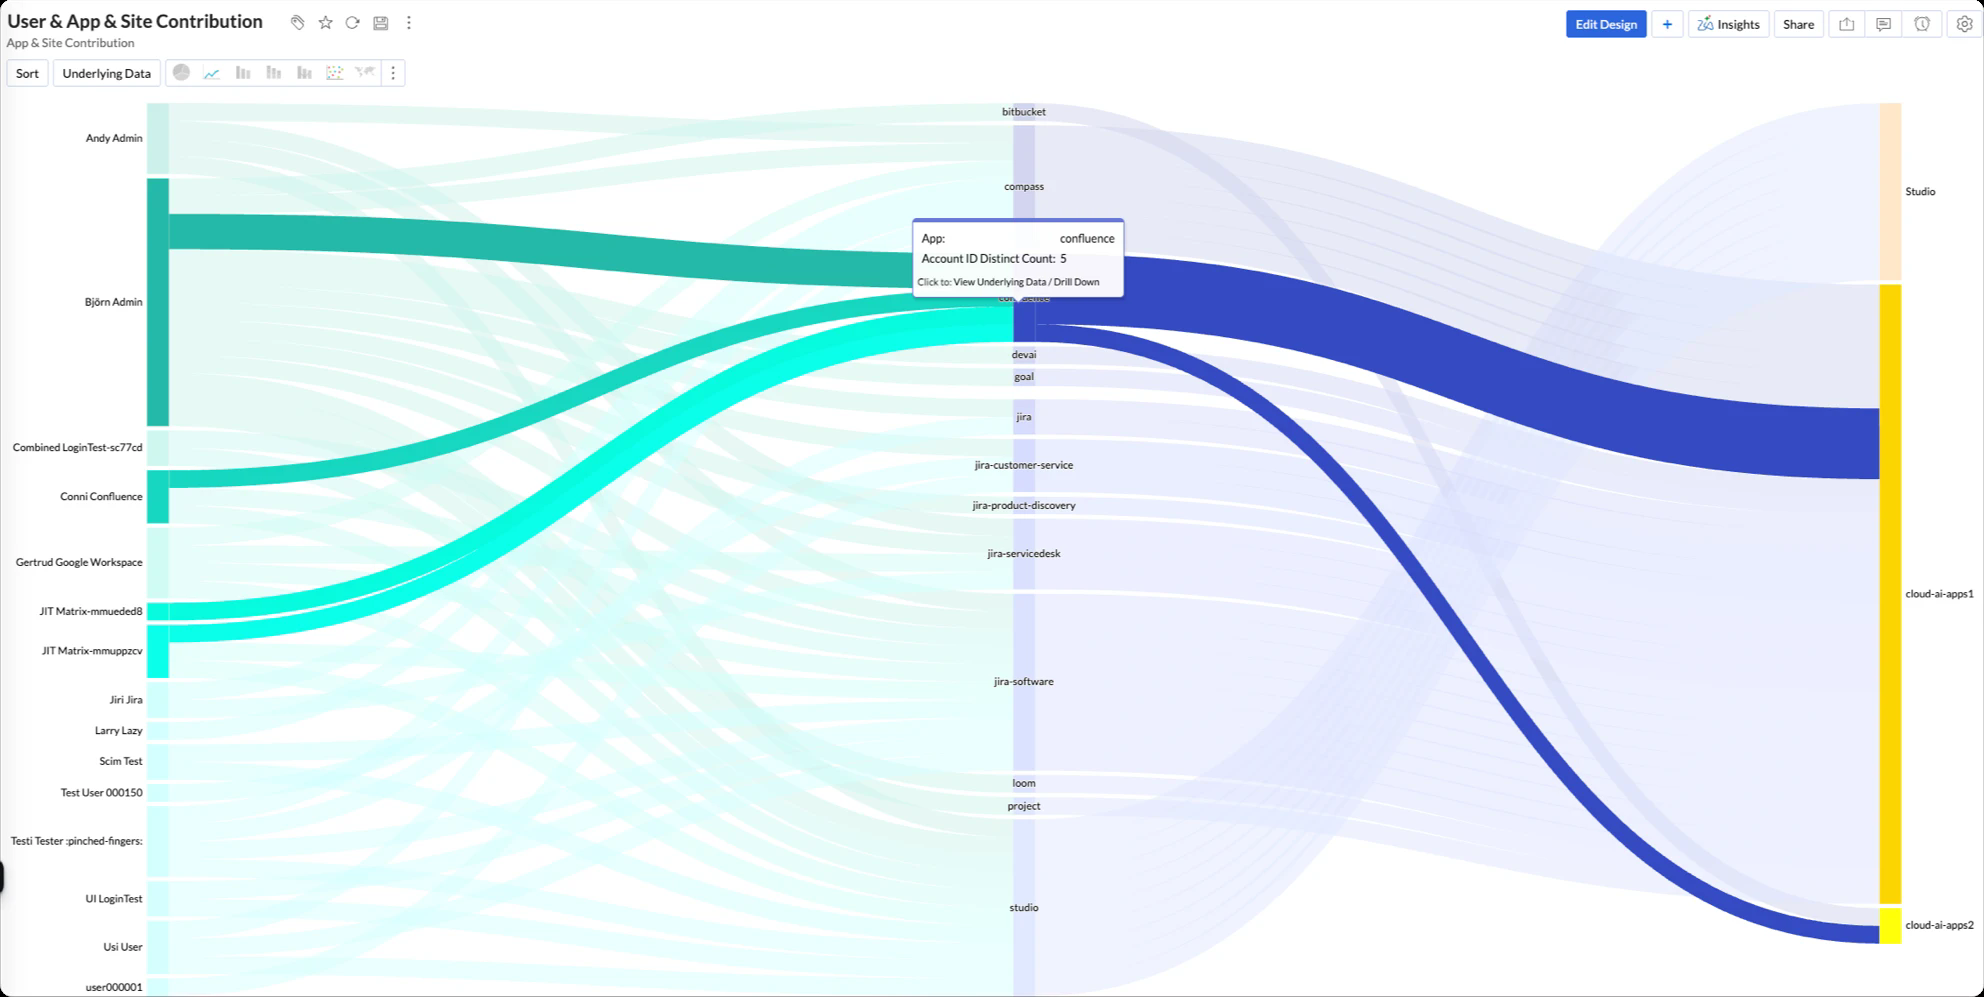
User to app to site contribution, built from the Display Name, App and Site columns.
The screenshots above were produced in a BI tool from an exported file. The export gives you the raw data; any reporting tool can then chart it however you need.