
My Overview
My Overview is a personal dashboard that displays your individual performance metrics for the selected meeting stream. It shows how many issues you have remaining, your goal completion rate, standup participation, and a daily work output graph.
Accessing My Overview
To access My Overview:
Open the NASA app in Jira.
Select a meeting stream from the Select Meeting Stream dropdown at the top.
Click My Overview in the left sidebar navigation.
The dashboard loads your personal metrics for the selected stream.
Dashboard Metrics
The top of the My Overview dashboard displays three key metrics for the current sprint or cadence:
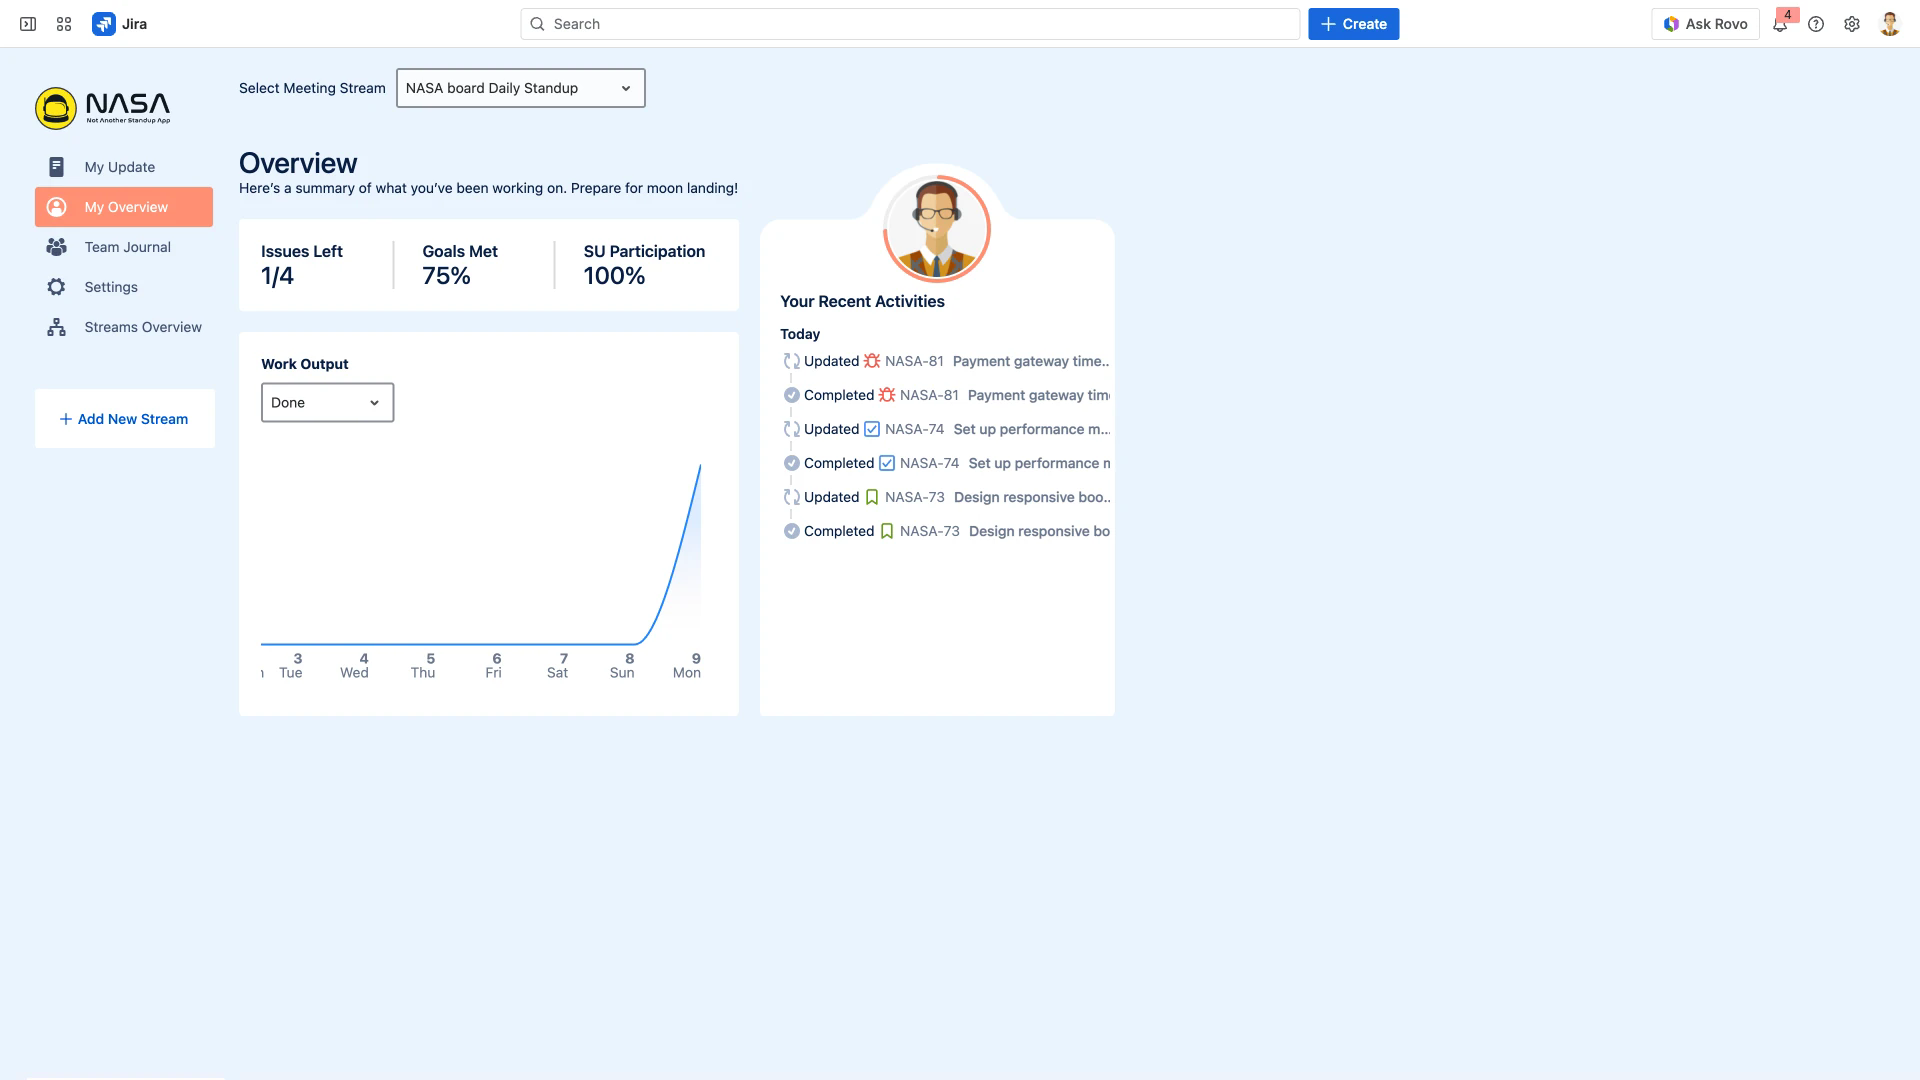
Issues Left - The number of your remaining issues out of the total assigned to you in the current sprint or cadence. For example, “1/1” means one issue remains out of one total.
Goals Met - The percentage of your assigned issues that have been completed in the current sprint or cadence.
SU Participation - Your standup attendance rate as a percentage. This tracks how often you participated in standup meetings during the current sprint or cadence.
Work Output Graph
Below the metrics, the Work Output graph visualizes your daily issue movement over the current sprint or cadence. The graph plots the number of issues per day on a timeline.
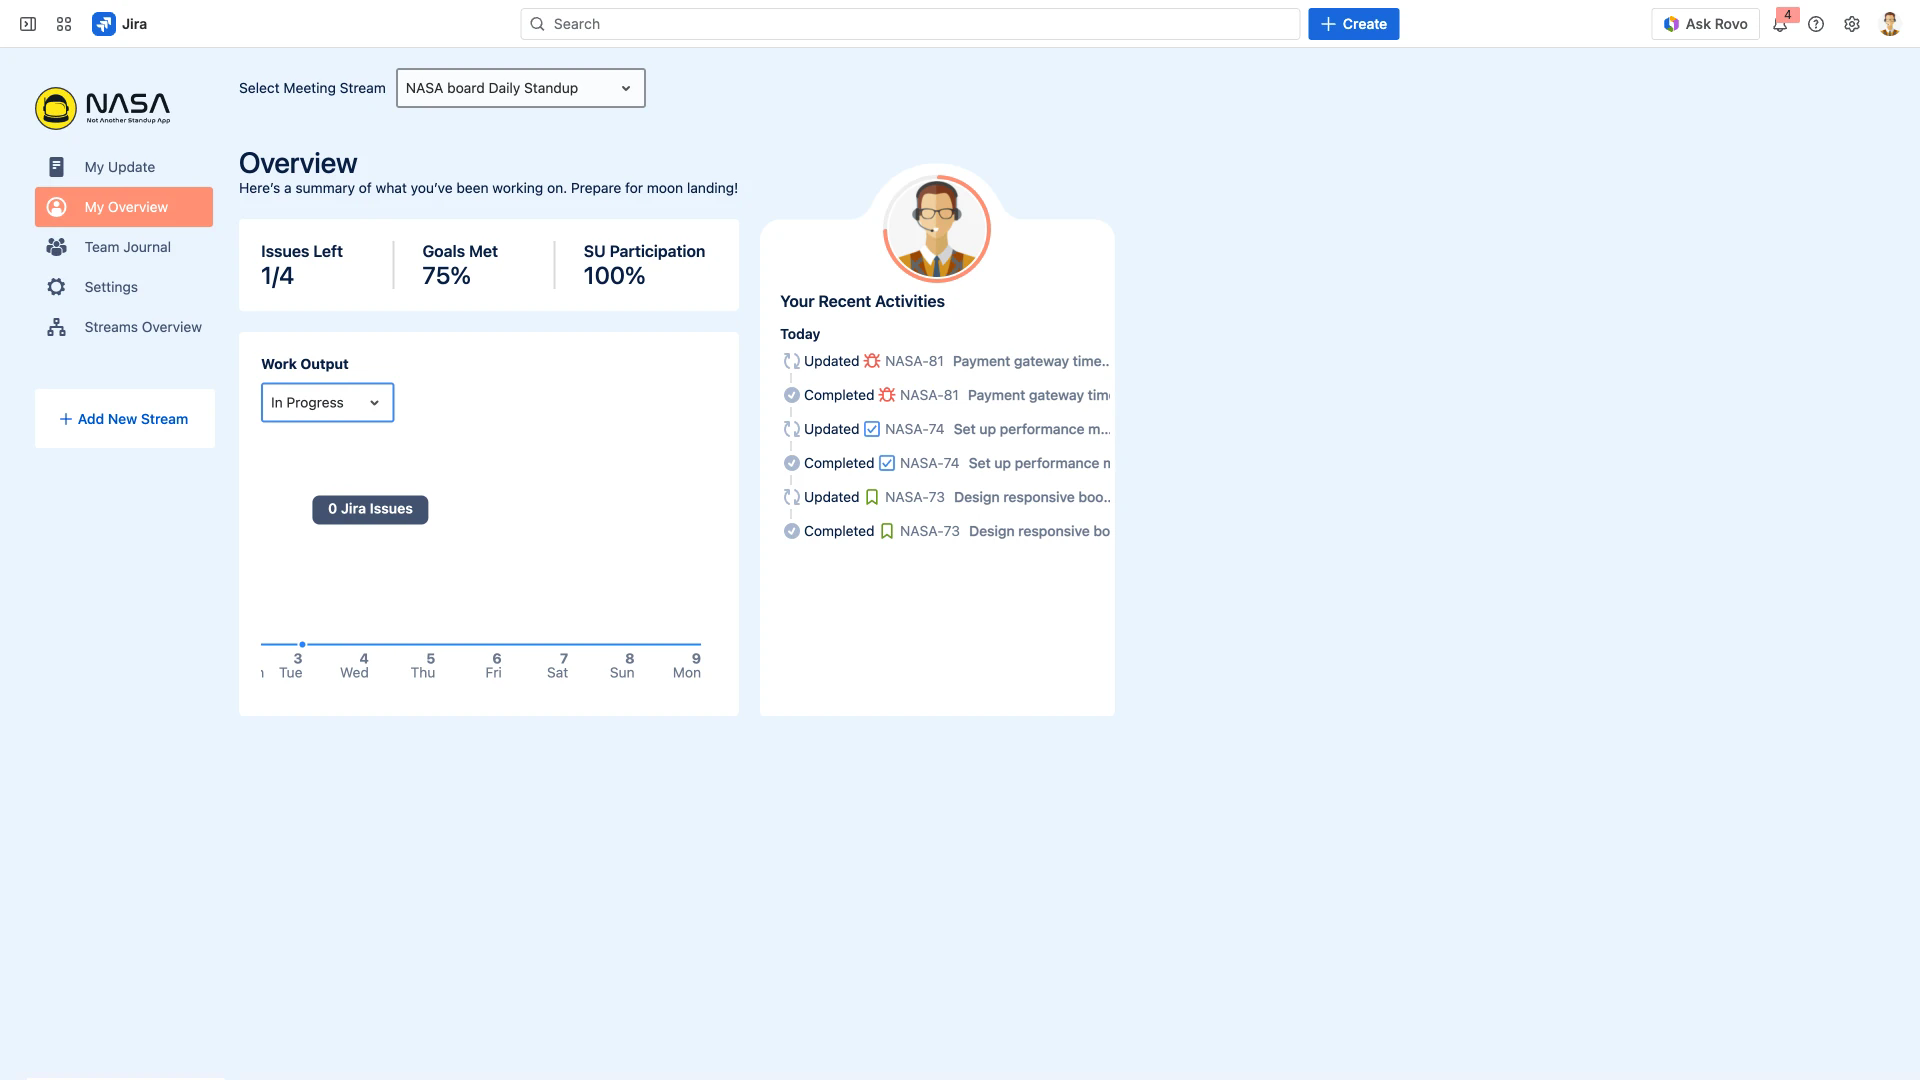
Use the dropdown above the graph to switch between two views:
Done - Shows the number of issues you completed each day.
In Progress - Shows the number of issues you had in progress each day.
Recent Activities and Progress Circle
On the right side of the dashboard, you will find:
Your Recent Activities - A list of issues you recently worked on, along with their status updates. When no recent activity exists, a “No Updates” placeholder is shown.
Progress Circle - A circular progress indicator around your profile image that reflects your Goals Met percentage for the current sprint or cadence.
My Overview shows personal metrics for the selected meeting stream. To view your metrics for a different stream, use the Select Meeting Stream dropdown at the top of the page.